Epic Worlds 2016: A Retrospective
This is a guest blogpost by Josiah Fiscus. Josiah Fiscus is a 31-year-old gamer from Pittsburgh, PA who has been playing CCGs and designer board games for over two decades. When he’s not at the game table, you’ll find him playing drums and serving as a deacon in his local church or enjoying time outdoors with his wife, Erin, and two kids (ages 5 and 4).
It’s been pretty incredible to see how just 48 new cards have completely shaken up the metagame in Epic. I ran the numbers after the Origins constructed events (full analysis here: Origins Analysis) and they were heavily skewed towards Sage and Wild decks. That is certainly not the case anymore. In fact, I’d venture to say the game is more balanced than it has ever been, at least in terms of alignment prevalence.
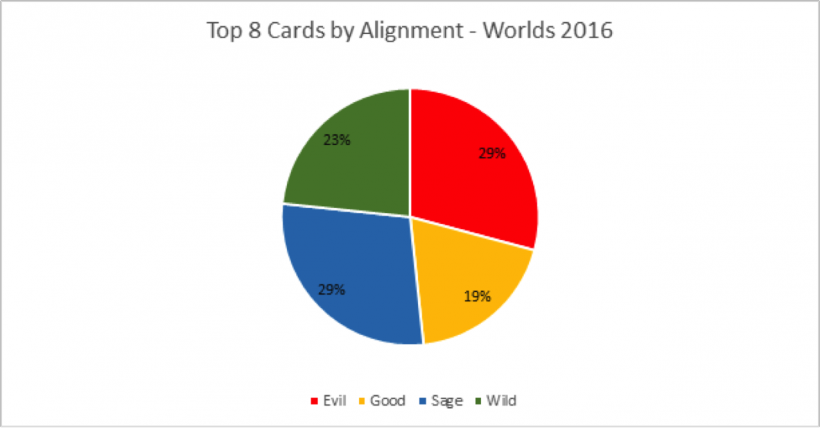
At Origins, Good and Evil combined didn’t even crack 25%. But at Worlds, we had a nearly even split. Cards like Ceasefire that have always been good but just “looking for a deck” have come into their own Chamberlain Kark. And the rise of Kark has also given rise to Evil value cards to counteract this while simultaneously pushing Wild burn onto the back burner.
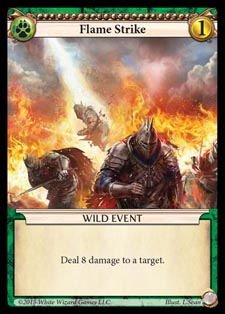
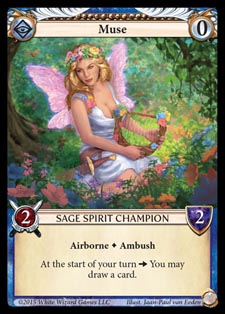
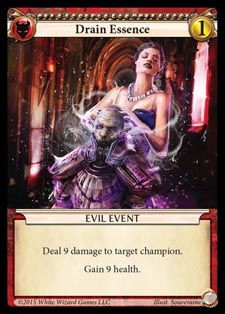
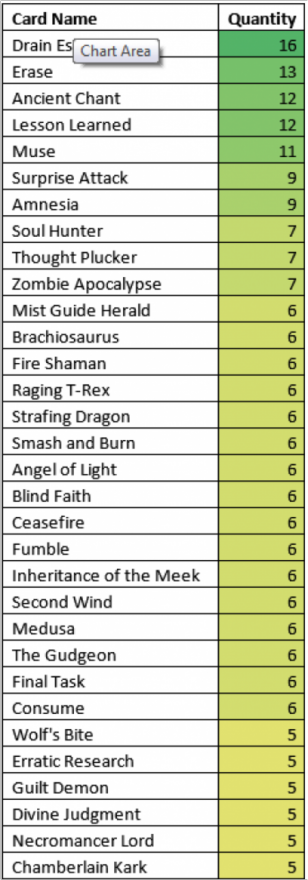
On a card-by-card basis, the most played cards were very different as well. At Origins, the 5 most played cards were, Flame Strike, Surprise Attack, Arcane Research, Fireball, and Muse. By Worlds, only Muse still remained in the top five. Surprise Attack fell to #6. Perhaps most surprisingly, Flame Strike was nowhere to be seen! Its role seems to have been usurped by Drain Essence, a card which was tied for 29th most used at Origins but is now handily the number one card.
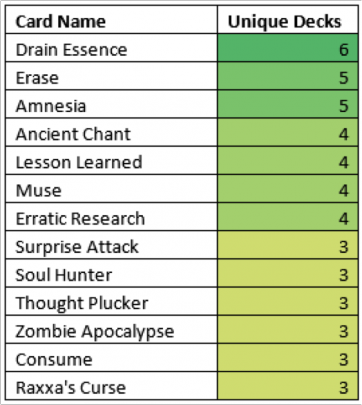
But this balance across alignments does not necessarily imply a diversity of decklists. In fact, there were only 6 unique decks in the top 8. Each was only considered once for the analysis above, thus Drain Essence actually appeared in every deck.
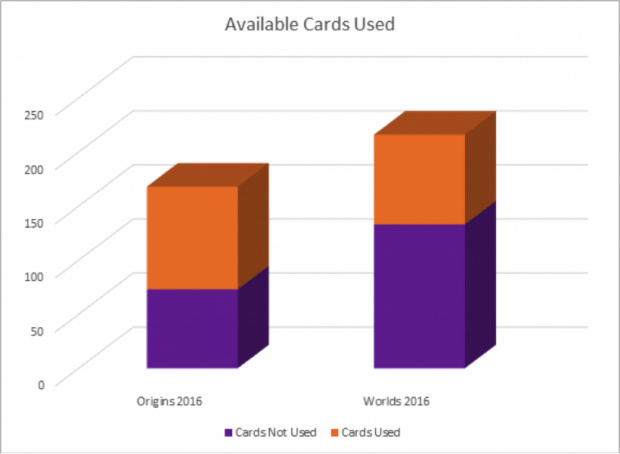
At Origins, while the construction of decks was slanted heavily towards Wild and Sage, there were 95 unique cards played (out of a possible 168). Thus 57% of the available card pool showed up in decks that made the Top 8. However, despite Uprising adding 48 new cards, the Top 8 constructed decks at Worlds only made use of 83 unique cards, a lower actual number than at Origins, but all the more striking since the total possible card pool has grown to 216. Only 38% of the possible cards made a constructed appearance at Worlds.
That said, it is possible (and even likely) that as the card pool increases, the percentage of available cards used will always decrease. If, for example, the card pool grows to 1000 cards in the future, the unique cards used in eight 60-card decks will always be less than half, even if every card was a singleton in every deck. So this analysis must be taken with a grain of salt, yet it does perhaps show that the metagame has narrowed more than it has widened, despite a better distribution of cards across alignments.
I also wanted to consider the relative constructed prevalence of each expansion set. These are statistics that will become more and more intriguing as each new set comes out. The one thing that we can say for now is that Tyrants has had the highest percentage of its cards used in both events. Obviously it was and is a very solid set for constructed. My intuition is that the percentage for Uprising will actually creep higher in future tournaments. It was such a new set that I know many players were hesitant to include cards without further testing, even though they looked solid on paper.
| Unique Cards Used | Unique Cards Not Used | Percentage of Set Used | |
|---|---|---|---|
| Base Set | 66 | 54 | 55% |
| Tyrants | 29 | 19 | 60% |
| Unique Cards Used | Unique Cards Not Used | Percentage of Set Used | |
|---|---|---|---|
| Base Set | 44 | 76 | 37% |
| Tyrants | 22 | 26 | 46% |
| Uprising | 17 | 31 | 35% |
Finally, in the same vein, let’s look at the actual raw numbers of included cards by sets. We want to weight these according to what percentage of the potential card pool a given set comprises. In other words, if sets are balanced in constructed appeal, we should expect the first percentage listed for a set to be very close to the second percentage listed.
| Set's Percentage of Total Cards Used | Set's Percentage of Total Available Card Pool |
|
|---|---|---|
| Base Set | 70% | 71% |
| Tyrants | 30% | 29% |
| Set's Percentage of Total Cards Used | Set's Percentage of Total Available Card Pool | |
|---|---|---|
| Base Set | 60% | 56% |
| Tyrants | 27% | 22% |
These numbers are very encouraging and seem to indicate a general balance across sets with, again, Tyrants being a bit stronger than might be expected and some hesitation to include cards from such a new set, Uprising. As more 2017 qualifier results start to trickle in, I’ll be keeping a close eye on these numbers, as I’m sure you will as well.
Recent Comments